Prime Factorization Visualization with R and Shiny
Quite a lot of people have had fun recently with prime factorization. It all started on The Math Less Traveled, then various versions of the prime factorization diagrams appeared (here, here, this animated one, etc., they are actually more or less listed here). So I wanted to have fun too and give a try at Shiny since, again, everybody was having fun with Shiny but me. So here it is.
Original idea
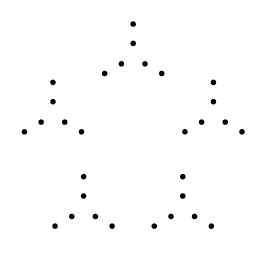
The original idea of this prime factorization visualization is to take an integer, factorize it, and display the number as dots arranged in groups of the smallest prime, themselves being arranged by groups of the next prime, and so on. I guess a visual example makes things simple, so take for instance 30. It’s 2x3x5, so the 30 points are first by groups of two, these groups of two are in some sort of triangle, the five triangles forming a pentagone.
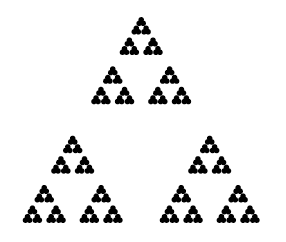
This kind of visualization can turn out to give elegant and sometimes well-know figures, like the Sierpinski triangle (here with N=243).
So this kind of plot is actually pretty straightforward to implement in R. Obviously, you first need a function to factorize the integer. Don’t bother implementing one since the gmp package provides just this. If you are using Linux, make sure you have the GNU MP library installed, as you will need it to install the package. From then on, it’s only a matter of recursivity and rotation to find the location of the points and… simply plot them! Here is a simple implementation, but we will do better below:
require(gmp)

# drawPFV is called recursively, where pts is the sequence of primes
drawPFV <- function(center, length, pts, direction=0) {
  if(length(pts)==0) return() # if no primes left, we don't do anything
  for(i in 1:pts[1]) {
    point <- center +   # point correspond to one "branch" of the star
      length*c(cos(direction+pi/2+i*2*pi/pts[1]),
               sin(direction+pi/2+i*2*pi/pts[1]))
    if(length(pts)==1)  # if we are at the end of the sequence of primes, we draw the points
      points(x=point[1], y=point[2],pch=20)
    nextdirection <- 0  # otherwise we define the direction for the next star
    if(pts[1]==2) nextdirection <- direction + pi/2
    if(length(pts)>1)
      if((pts[1]!=2)&(pts[2]==2)) nextdirection <- direction+i*2*pi/pts[1]
    # then we go to the next star
    drawPFV(center=point, length=length/((pts[1])^(1/1.25)), pts=pts[-1],
            direction=nextdirection)
  }
}

# make a Prime Factorization Visualization
makePFV <- function(N) {
  # this is a blank plot
  plot(x=c(-1.6,1.6),y=c(1.6,-1.6),pch='',xlab='',ylab='',asp=1, bty='n',axes=F)
  # we factorize N and sort N
  primes <- rev(as.numeric(factorize(N)))
  # we start the recursion
  drawPFV(center=c(0,0),length=1,direction=0,pts=primes)
}
Some more creativity
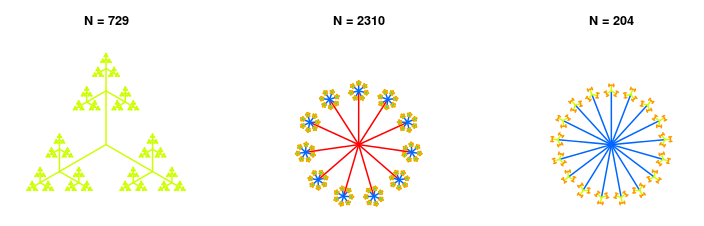
Nevertheless, these charts are a bit bleak, so we could potentially improve them. Here are two ideas: instead of charting the final points, we could draw the lines leading to the points (giving us some kind of trees, in the spirit of these ones), but also we could add colours! Here I’ll simply choose the colour based on the last digit of the prime, picking the colour in rainbow(10) for simplicity.
From an implementation point of view, the details will be below, but I add two parameters to the drawPFV and makePFV functions, namely segments and colour to make them a bit more usable (and more importantly, usable in Shiny!). Again, we can come up with some good looking figures! Here are three examples below with N equal 729, 2310, 204.
And finally, Shiny!
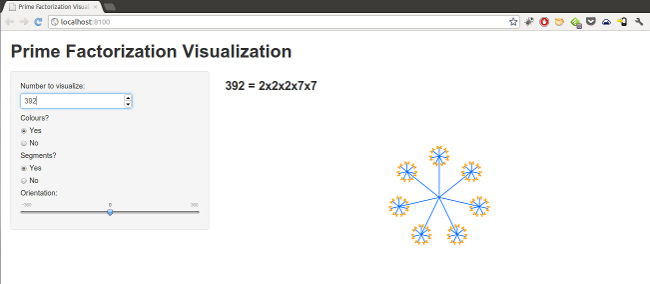
The final thing here so that everyone can play with this visualization tool smoothly is to port it to Shiny. I have played with Rook in the past and still do, but Shiny is by far simpler to use.
The web app allows you to choose your N, if you want points or segments, if you want colours or not and even rotate the visualization. You can directly go ahead and try running shiny::runGist('4121616') (remember to have the Shiny and gmp packages installed!). Otherwise, here is a screenshot of the app and the code (also available here).
server.R:

library(shiny)
library(gmp)

drawStar <- function(center, length, pts, direction=0, segments=F, colour=F) {
  if(length(pts)==0) return()
  if(segments & (pts[1]==2)) direction <- direction + pi/2
  for(i in 1:pts[1]) {
    point <- center +
      length*c(cos(direction+pi/2+i*2*pi/pts[1]),
               sin(direction+pi/2+i*2*pi/pts[1]))
    if(!segments) {
      if(length(pts)==1)
        if(colour) {
          points(x=point[1], y=point[2],pch=20,col=rainbow(pts[1])[i])
        } else {
          points(x=point[1], y=point[2],pch=20)
        }
      nextdirection <- 0
      if(pts[1]==2) nextdirection <- direction + pi/2
      if(length(pts)>1)
        if((pts[1]!=2)&(pts[2]==2)) nextdirection <- direction+i*2*pi/pts[1]
    } else {
      if(colour) {
        lines(x=c(center[1], point[1]), y=c(center[2], point[2]),col=rainbow(10)[pts[1]%%10],lwd=2)
      } else {
        lines(x=c(center[1], point[1]), y=c(center[2], point[2]))
      }
      nextdirection <- direction + i*2*pi/pts[1]
    }
    drawStar(center=point, length=length/((pts[1])^(1/1.25)), pts=pts[-1],
             direction=nextdirection, segments=segments, colour=colour)
  }
}

makePFV <- function(N, segments=F, colour=F, direction=0, order='desc') {
  plot(x=c(-1.5,1.5),y=c(1.5,-1.5),pch='',xlab='',ylab='',asp=1, bty='n',axes=F)
  primes <- switch(order,
                   asc=as.numeric(factorize(N)),
                   desc=rev(as.numeric(factorize(N))),
                   rand=sample(as.numeric(factorize(N))))
  drawStar(center=c(0,0),length=1,direction=direction,pts=primes,segments=segments,colour=colour)
}

shinyServer(function(input, output) {

  output$caption <- reactiveText(function() {
    paste(input$N,'=',paste(as.numeric(factorize(input$N)),collapse='x'))
  })

  output$visuPlot <- reactivePlot(function() {
    makePFV(N=input$N,
            segments=ifelse(input$segments=='yes',T,F),
            colour=ifelse(input$colour=='yes',T,F),
            direction=input$direction*2*pi/360)
  })
})

ui.R:

library(shiny)

# Define UI for application that plots random distributions
shinyUI(pageWithSidebar(

  # Application title
  headerPanel("Prime Factorization Visualization"),

  # Sidebar with a slider input for number of observations
  sidebarPanel(

    numericInput("N", "Number to visualize:", 2*3*3*7),

    radioButtons("colour", "Colours?",
                 list("Yes" = 'yes',
                      "No" = 'no')),

    radioButtons("segments", "Segments?",
                 list("Yes" = 'yes',
                      "No" = 'no')),

    sliderInput("direction",
                "Orientation:",
                min = -360,
                max = 360,
                value = 0)
  ),

  # Show a plot of the generated distribution
  mainPanel(
    h3(textOutput("caption")),

    plotOutput("visuPlot")
  )
))
Comments
blog comments powered by DisqusRecent Posts 
- Optimal Meeting Point on the Paris Metro (Mar 2013)
- 1 + 1 = 3, the proof in R (Dec 2012)
- Prime Factorization Visualization with R and Shiny (Nov 2012)
- A thermometer in R using Arduino and Java (Nov 2012)
- Multiple progress bars (Feb 2012)