Multiple progress bars
It is pretty easy to monitor the progress of a long loop in R using the original txtProgressBar function in the utils package.
It works like this:
mypb <- txtProgressBar()
m <- sapply(1:1000, function(x) {
  setTxtProgressBar(mypb, x/1000)
  mean(rnorm(x))
})
close(mypb)
You could even get a GUI-type output using tkProgressBar from the tcltk package, or winProgressBar.
Or you could build your own. The solution lies in three lines of code:
plot.progress <- function(percent) {
	      plot(c(0,100), c(0,1), type='n', xlab='', ylab='', yaxt='n')
	      rect(0, 0.1, percent*100, 0.9, col='blue')
	      title(paste('Progress: ', round(percent*100,2), '%', sep=''))
}
plot.progress(0.8711)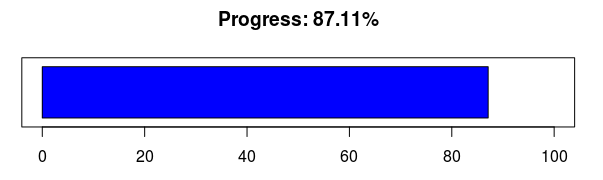
What is more interesting is that you can now easily handle multiple progress bars at once, which can prove quite useful when you have embedded loops.
plot.progress <- function(...)	{
  vectOfBar <- c(...)*100
  numOfBar <- length(vectOfBar)
  plot(c(0,100), c(0,numOfBar), type='n', xlab='', ylab='', yaxt='n', mar=c(3,3,3,3))
  for(i in 1:numOfBar) {
    rect(0, 0.1+i-1, vectOfBar[i], 0.9+i-1, col=rainbow(numOfBar)[i])
    text(0.5, 0.5+i-1, paste('Status ', i, ': ', round(vectOfBar[i],2), '%', sep=''), adj=0)
  }
  title('Progress...')
}
plot.progress(0.7543, 0.6918, 0.3454)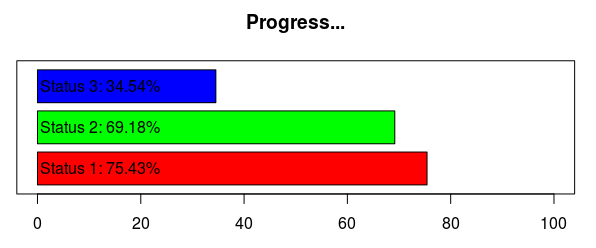
Comments
blog comments powered by DisqusRecent Posts 
- Optimal Meeting Point on the Paris Metro (Mar 2013)
- 1 + 1 = 3, the proof in R (Dec 2012)
- Prime Factorization Visualization with R and Shiny (Nov 2012)
- A thermometer in R using Arduino and Java (Nov 2012)
- Multiple progress bars (Feb 2012)